
The Items Use in Operations Report answers how much of each item the documents of one type used in a period, for example how many of each item were sold last month, next to the stock now and the item’s prices. Every item has a row, also when no document used it. Open it from Reports → Items → Items Use in Operations….
Filter
The Items Use in Operations Report window opens first. Fill in only the filters you need: an empty filter does not limit the report. Click OK to run the report. Clear empties the filters and sets the check boxes back to their default. The window keeps the last filter you ran.
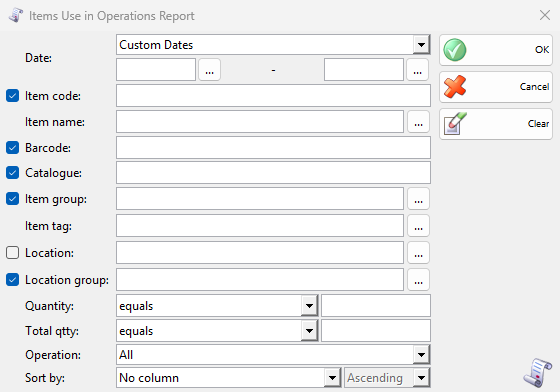
The check box in front of a filter puts its column in the result. A cleared check box also adds the rows up over that column: Location: is cleared by default, so an item has one row for all locations, or one row for each location group while Location group: is selected. A filter without a check box always has its column. A text filter finds the values that contain the text. Press F4 or click … to choose from a list.
| Filter | What it limits | Column by default |
|---|---|---|
| Date: | The period of the documents counted in Total Qtty. Choose a period from the list, or Custom Dates and a start and an end date. Without dates all documents count. | No column |
| Item code: | The items by code. | Shown |
| Item name: | The items by name. | Always shown, no check box |
| Barcode:, Catalogue: | The items by barcode or catalogue number. Each adds three columns. | Shown while Show barcodes or Show catalog numbers is selected in the item window |
| Item group: | The items of a group. | Shown |
| Item tag:, Location tag: | Listed when such tags exist. They only filter. | No column |
| Location: | The locations. | Not shown |
| Location group: | The locations of a group. | Shown |
| Quantity: | The rows by the quantity in stock now, more, less or equal to a number. | Always shown, no check box |
| Total qtty: | The rows by Total Qtty, for example more than 0 for the items the documents used. | Always shown, no check box |
| Operation: | The type of the documents counted in Total Qtty. All counts every type. Transfer counts the transfers into the locations and Production the ingredients. Purchase does not limit the report: the result is the same as with All. | No column |
| Sort by: | Sorts by Code, Item, Location, Quantity or Total Qtty, ascending or descending. | – |
Results
The result opens in its own tab. The example below has Sale in Operation:, the last ten days in Date: and more than 0 in Total qtty:, so it lists the items sold in these days. Barcode:, Catalogue: and Location group: are cleared, so each item has one row for all locations.
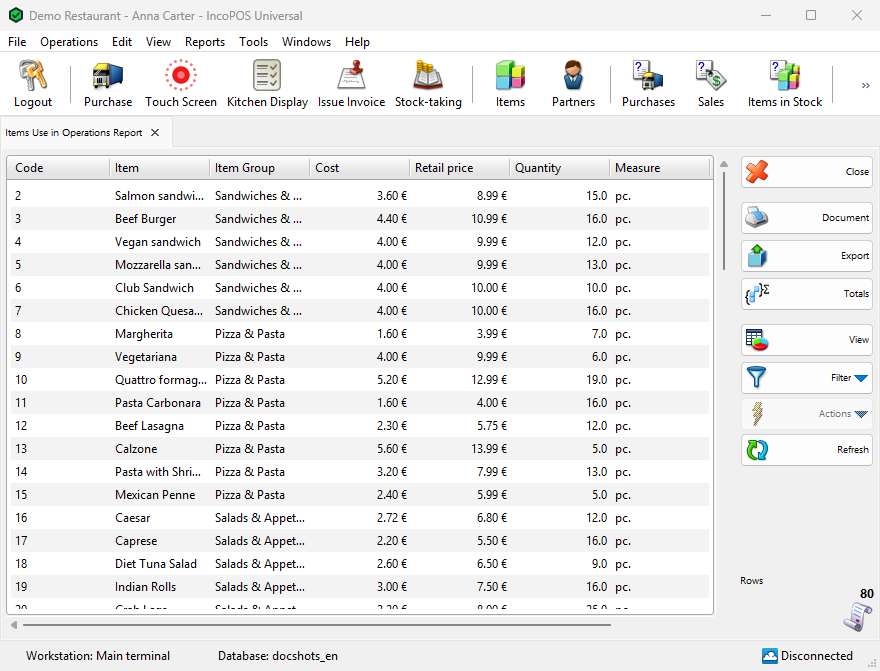
| Column | What it shows |
|---|---|
| Code, Item, Barcode 1 to 3, Catalogue 1 to 3, Item Group, Measure | The item, as it is now in Items. Quantities are in this Measure. |
| Location, Location Group | The location. With Location shown, every item has a row in every location. |
| Cost | The purchase price of the item now. |
| Retail price | The item’s retail price now, under the name the price group has in your program. |
| Quantity | The quantity in stock now. The date filter does not change it. |
| Total Qtty | The quantity of the item in the documents of the chosen type and period. |
How the numbers are counted
- Total Qtty counts saved documents. Drafts and documents still pending in another database are left out. An annulled document no longer exists, so it is not counted.
- A document counts on its Date, the date of the document, not on the day it was saved or edited.
- Total Qtty adds the quantities of the rows as they are, without a sign: with All, purchases and sales add up together. A stock-taking counts with its difference, counted minus available.
- When you work with lots, Total Qtty is counted once for each lot of the item in the location.
- Deleted items are left out. The prices are those of the items now.
Work with the results
Document opens the print preview of the result with its filters, and Export saves it to a file. Totals adds a row with the totals of the quantity columns. View shows the result as bars or a pie (see View Report Results). Filter → Report Filter shows the filters next to the result and runs it again as you change them, Report Filter as New… opens the result of another filter in a new tab, and Quick Filter searches the text of the rows. Refresh runs the report again. The report can also be a panel of the Dashboard.
Double-click a row or use Actions → Edit to open its item. Actions → Transform Selected Items puts the selected items in a new document (see Transform Document). Actions → Print Selected Items prints their labels when a quick print setup of Print Barcodes exists.
Permissions
All permissions are set in Edit → Administration → Permissions….
| Permission | What it allows | Not allowed by default for |
|---|---|---|
| Reports → Items → Items Use in Operations… | The report. | Operators (the whole Reports menu) |
A user with a Locked location: in the user’s settings gets that location fixed in the filter. With Show items available quantity cleared there, the user does not see Quantity, and with Show items purchase price cleared not Cost.
FAQ
How do I see the best-selling items of a month?
Choose Sale in Operation: and the month in Date:, set Total qtty: to more than 0 and sort by Total Qtty descending.
Why does the report list items that were not used?
Every item has a row, with Total Qtty 0 when no document used it. Set Total qtty: to more than 0 to leave them out, or use Items not in Use in Operations to list only them.
Why does an item have several rows?
Location group: is selected by default, so an item has one row for each location group. Clear it for one row per item, or select Location: for one row per location.