The Items flow report is a mathematical summarizing of operations by items. The current quantity and income/expense is defined in a separate column for each item. You can use this report for summary tracking of all documents and operations. The quantity in the report is the item quantity in all selected documents and operations. You can track the total quantity in sales, purchases and other operations for a single item. Each item is displayed on a separate row in the report.
In the first window of the report specify the filter criteria and the fields that will be visualized.
Only rows that are checked are visualized in the report.
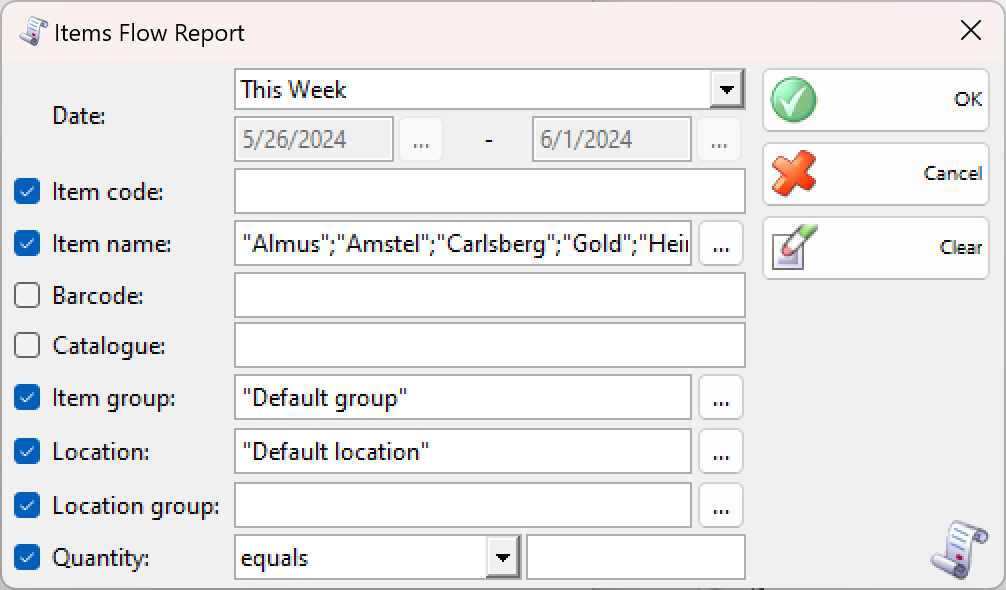
You can choose a filter for each field by pressing the F4 key.
You can limit the report to a single criterion. For example, you can visualize a particular item flow. You can also apply several criteria at a time – for example, visualize a particular item flow for a specific period of time.
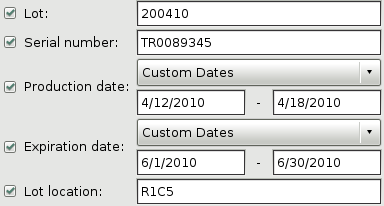
If you are working with lots, the application will add filters about the lot number, serial number, production date, expiration date and lot location.
To remove all specified filters, click the Clear button. The report will display all operations without any restrictions.
Click the OK button to generate the report using the specified criteria. Click Cancel to close the window.
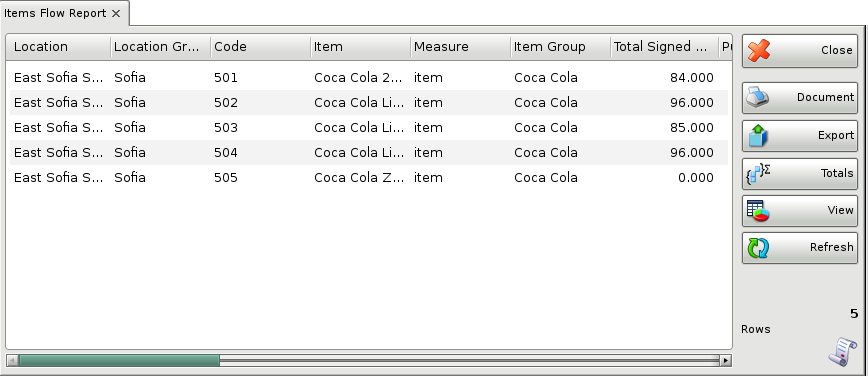
Close button closes the report, Document button is used for report print preview, button Export to exports the report to CSV, Excel, Web Page or XML Data format and Totals button adds a line at the bottom of the window, that contains quantities and values amounts for each column.