In the first window of the report specify the filter criteria and the fields that will be visualized.
Only rows that are checked are visualized in the report.
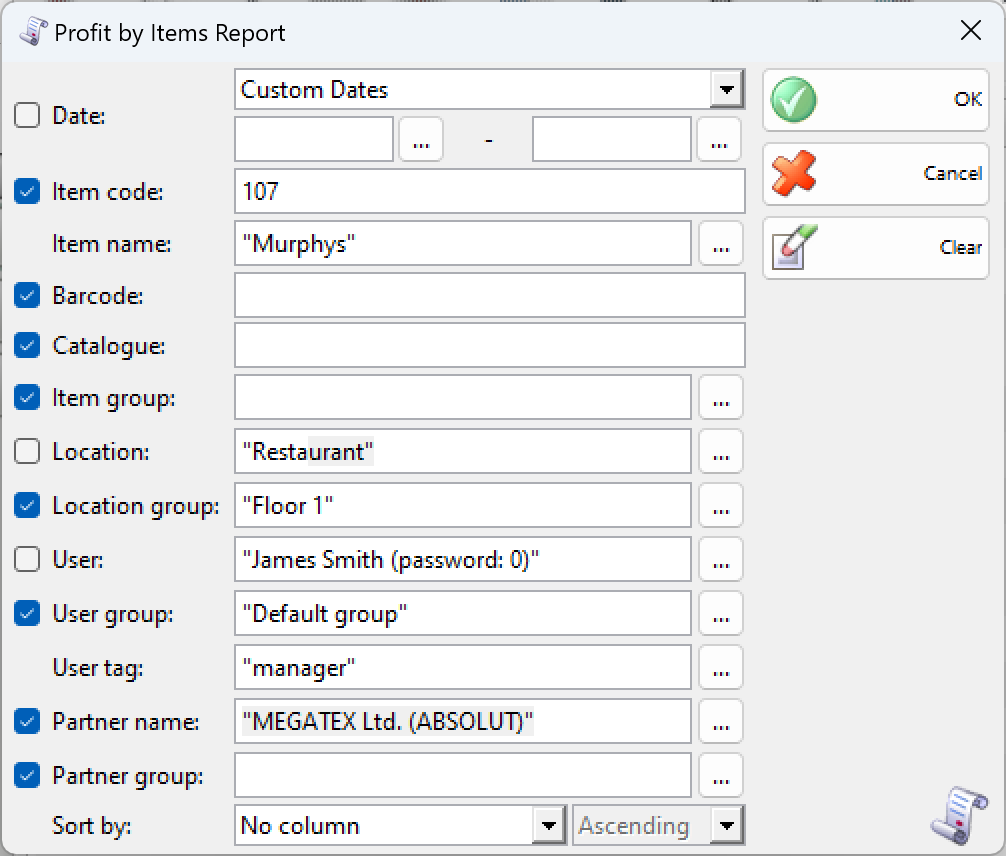
You can choose a filter for each field by pressing the F4 key.
You can limit the report to a single criterion. For example, you can visualize the profit of a particular item. You can also apply several criteria at a time – for example, visualize the profit for a specific partner and for a specific period of time.
To remove all specified filters, click the Clear button. The report will display all operations without any restrictions.
Click the OK button to generate the report using the specified criteria. Click Cancel to close the window.
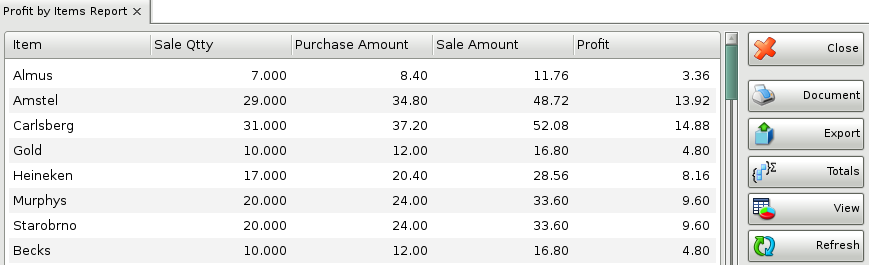
The report contains information about sold items and their total profit in a descending order. It displays the code, name and barcode of the item, as well as the date, the location and the company, which has acquired the profit.
Close button closes the report, Document button is used for report print preview, button Export to exports the report to CSV, Excel, Web Page or XML Data format and Totals button adds a line at the bottom of the window, that contains quantities and values amounts for each column.