Report Designer represents a mechanism for creating individuals reports, depending on the needs of each client. After being created these reports appear in the Custom Reports menu and not differ from the standart reports.
To open Report designer choose Reports->User Reports->Edit Reports->button New.
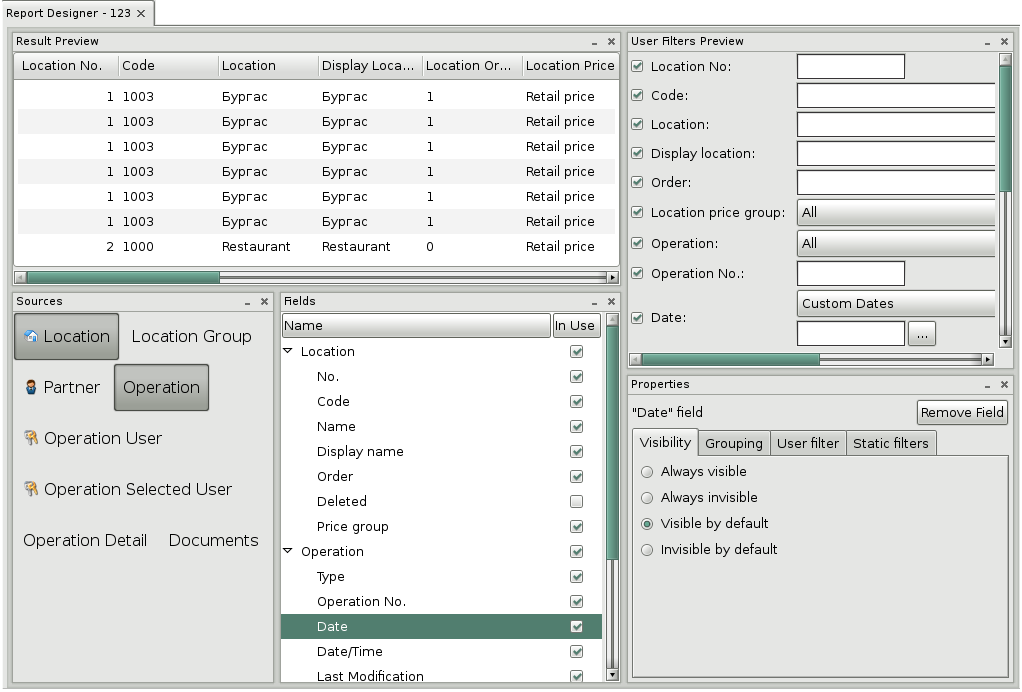
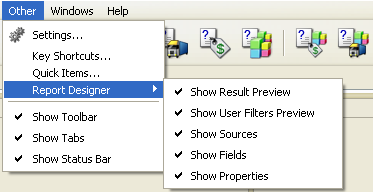
The module Report designer consists of five sections – Result Preview, User Filters Preview, Sources, Fields and Properties. You can disable and enable them from the menu Other->Report Designer. It is active only when Report Designer is opened.
1. Sources
Section Sources contains list of all tables in the base which can be used for creating reports. When you select a source only a part of all sources will remain visible. With those sources the chosen one can make a connection. For example if you select Payment source only Partner, Location, User and Payments type will remain visible for choice.
2. Fields
Section Fields contains all chosen sources and their fields. By default they are checked, which means that they are visible in the report. Uncheck the fileds which you don’t want to see in your report and they will be removed from the filter form.
3. Properties
In this section you can set different properties of the filter like: level of visibility, filter logic, filter type and grouping of the result.
3.1 Visibility – determines the filter level of visibility:
Always visible – the filter is without check box and always is visible in the result.
Always invisible – the filed is visible in the filter form so that you can filter on it, but it is invisible in the result.
Visible by default – the filter is with check box that is checked and you can choose whether to see the field in the result.
Invisible by default – the filter is with check box that is not checked but you can choose whether to see the field in the result.
3.2 Grouping
No grouping – the rows in the result are not grouped by equal values.
Group together same values – the rows in the result are grouped by equal values.
The maximal value – the rows are grouped by maximal value
The minimal value – the rows are grouped by minimal value
The average value – the rows are grouped by average value
The sum of all values – the rows are grouped by taking the sum of all values
The number of all values – the rows are grouped by taking the number of all values
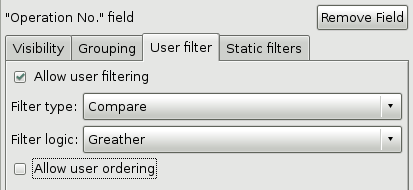
3.3 User filters
Allow user filtering – determines the type of the filter
Filter type:
Find – finds result comparing typed text. It is used for text fields as name, code, barcode and others.
Compare – filter with compare choice – greather, exact match, less. It is used for fields with amounts, quantities and prices.
Range – filter with range from given start to given end value. It is used for fields with document numbers and date interval.
No filter – the filter is inactive in order that you can not filter on it, but to be visible in the result.
Filter logic for Find:
Contains – finds results that contain the entered text
Exact match – finds exact match results
Starts with – finds results that start with the entered text
Ends with – finds results that end with the entered text
Filter logic for Compare:
Greater
Greater or equal
Exact match
Less or equal
Less
Allow user ordering – shows whether the selected field to be in the sort list and you can sort the report by it.
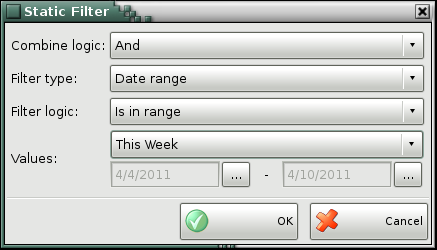
3.4 Static filters – you can create your own static filter if you want to see results only for specific operation, for determined period of time, for determined item, partner or user.
To add a static filter choose Add button.
Combine logic – you can choose between And, And not, Or, Or not
AND – finds the area where the conditions are recovered
AND NOT – if the result does not satisfy the condition
OR – if the result satisfies any of the conditions
OR NOT – or if the result does not satisfy the condition
Filter type – It can be find text results type, filter with compare conditions or range intervals. If the chosen field has defined types in the database like operation type, item type or user level then the filter offers you to select between one of these types.
Filter logic – If Find type is selected then in this option you can choose between Contains, Exact match, Starts with, Ends with. If Compare type is selected you can choose between equals, more than, less than. If Range type is selected you should enter start and end range values.
Values – It can be listed types, fields for start and end values.
4. Result Preview
This section shows what will be visualized in the report result.
5. User filters preview
User filter preview presents the filter form of the report.
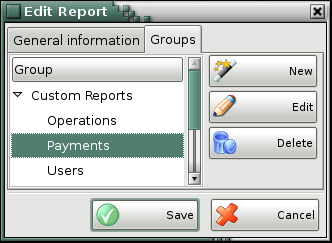
6. Preview and save the report
Use Test button to preview you report and to generate test result. If you want to change something you can turn back to the report designer. To save the report use the Save button. In the General information tab enter the report name and in the Groups tab select a group where you want to put your report or create a new one. To exit report designer without saving the changes press Close button.